For anyone who has a solar PV system for your home/business or is thinking about getting one, understanding electricity usage patterns throughout the day is integral for guaranteeing a good return on investment. Previously we published an in-depth article about getting the most out of a solar PV system, with a focus appropriate system sizing & conscientious power usage.
(Part 1 of this series looks at solar PV system size selection considerations.)
Since that time, Warwick Johnston of solar consultancy SunWiz has published an excellent, data-centric article that investigates the topic of electricity usage patterns in even more detail. On top of making the important point that Australia’s distributed solar PV systems easily ‘pay their way’ on the electricity grid – countering arguments to the contrary by the current government and Australia’s electricity infrastructure establishment – the article also serves as something of a sales guide for solar installers, as well as a user’s manual for solar system owners.
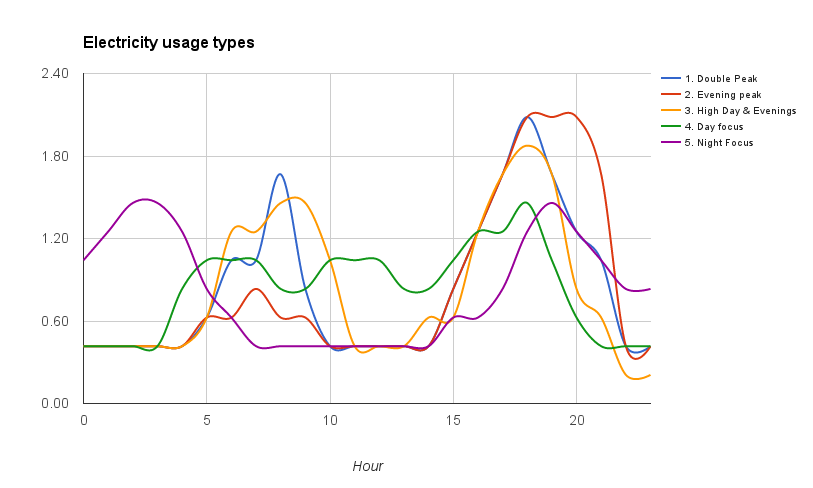 The usage profile graphs from Warwick’s article (which were generated using SunWiz’s PVSell software) will make it easier for future (and current) solar system owners to determine which electricity usage pattern they might fall into, thereby leaving them better informed about how to choose a appropriately-sized system and how to use that system after installation.
Which of these patterns that best fits any given home will undoubtedly change as time goes on and as behaviours change, children grow up and people move in and out. But being aware of what they are and when they best suit your household (or business) is an important first step in becoming a proactive electricity generator & consumer.
Note that the following graphs are intended only to provide some generalised insights into how a home’s electricity is used throughout the day, and as such do not include any actual usage figures – just the patterns over a 24-hour period.
Also note that none of these take into account the possible benefits of installing an energy storage system. Energy storage allows greater flexibility in when solar energy can be used – making it possible to consume your own power even after the sun has gone down.
1. Families with school-age children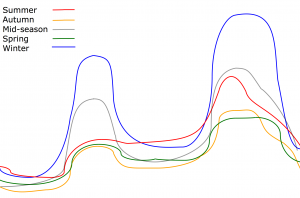
The ‘double hump’
Characterised by two distinct peaks denoting the flurries of activity associated with morning and afternoon routines. Low-level background electricity use continues throughout the day (mainly refrigerator, water heating & other devices on-all-day devices).
Ideas to get the most out from solar: Get a system that will take care of the baseline usage during the day, as system power generation is generally weaker in early morning & late afternoon, although it will also help eat away at the end of the morning peak and the beginning of the evening peak.
2. Households without school-age children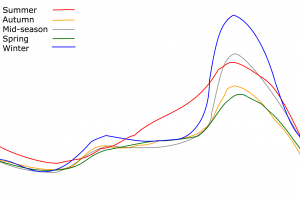
The evening peak
Characterised by a peak in usage when occupants get home from work and begin preparation for dinner, watching television, having showers, etc.
Solar tips: Again, best to select a system that will meet baseline daytime electricity demand and eat into the beginning of afternoon peak. Switch electricity loads as much as possible to daylight hours by scheduling clothes washing & drying (for example) to daylight hours).
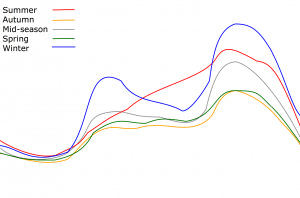 3. Households with infants & preschoolers
High day, higher evenings, low overnight
Similar to the ‘double hump’ mentioned above, but with more daytime usage.
Solar tips: More solar usage during the daytime as the home is occupied for a larger portion of the day, which means a larger system might be warranted and useful.
4. Day focus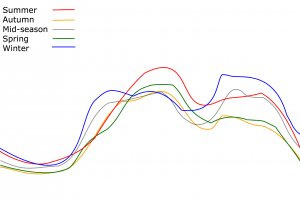
Retirees & those who work from home
Day focus households (and businesses) use a relatively steady amount of electricity throughout the day. They also have the most flexibility when it comes to choosing when to run their appliances.
Solar tips: These households are the best sort of household for solar power, as they use the bulk of their electricity when the sun is shining. Choosing a larger system is generally warranted in these cases.
5. Night focus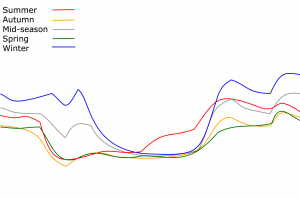
Mainly night shift workers
As the name indicates, night focus households have the inverse of the electricity usage pattern of day focus households. Most activity and electricity consumption takes place when the sun is not shining.
Solar tips: Night focus homes are those who would benefit the least from a solar system, unless they manage to shift a greater portion of their usage to daytime hours.
Not sure what size solar system would be best for your home or business?
Check out our Simple Solar PV System Sizing Estimator. Or if you’re interested in a battery+storage system, see our Solar Plus Battery Storage Sizing & Payback Estimator.
[This article was originally published in August of 2014.]
© 2016 Solar Choice Pty Ltd
- Solar Hot Water System: Everything You Need to Know - 27 February, 2024
- Enphase Battery: An Independent Review by Solar Choice - 20 January, 2024
- Can I add more panels to my existing solar system? - 8 August, 2023

Take away the 500W base load in these graphs, and these households will half their annual electricity usage (or bill – a little bit more complicated because of fixed daily charges of up to 1$).
500W energy used around the clock (the base line or lowest line around 0.5 left scale in the graphs), equals 12 kWh of electricity usage per day (0.5kW x 24 hours = 12 kWh). That is more than half of 20 kWh usage per day of these household as described in this article.
So get rid of all standby (including hardwired stuff like aircons and remote fans – turn them off at the breaker panel), microwave with a nice clock on it and entertainment electronics, turn off internet modems and wireless access points overnight)
Get rid of old unused and inefficient appliances (that old energy hog fridge and the old beer fridge in the basement everyone)
And get rid of inefficient lighting (halogen downlights) and replace with LED’s.
Install an energy efficient pool pump. This saves 2/3.
Choose to install insulation instead of buying that bigger 7kW aircon. A 3.5kW energy efficient model will suffice (5 stars or more).
How do I know how big my base load still is, you ask? Tell an electrician to install a whole house energy meter like one of these http://reductionrevolution.com.au/collections/wireless-energy-monitors
At that point – 8 kWh electricity usage per day, the 5 kWp solar system will also be able to produce enough electricity for not so sunny days and for an electric car.
8 kWh per day is not possible you say? Well we use 8 kWh per day for a two person household with a two year old, and we have aircons and a 50.000 litre pool, with an energy efficient pool pump of course.
These are great points, Diego. Thanks for commenting.
Would it be possible to annotate these graphs in terms of how the peaks and troughs relate to the % compared to overall kWh for the day? I’m guesstimating based on the relative sizes of the shapes in the graph, but if you have this data somewhere, a vertical axis would be really handy.
Hi John,
We’ve left out the numbers here on purpose – the aim in this article was primarily to allow readers to visualise what their electricity usage might look like based on the number of people (and their age) in their home. We have worked approximations of these usage patterns into a battery storage system sizing estimator tool that we’ve put together, but they’re only rough estimates. You can download the original data which SunWiz used to compose these charts on the AusGrid website.
For what they’re worth, I’ve included some output graphs from our estimator below. All of the charts are for 20kWh of electricity consumption with a 5kW solar system – they only thing that changes is the consumption pattern. You’ll see that there is data for two days – the solar output data that you see is the annual average for Sydney, repeated twice. (Please ignore the numbers that appear on the right axis in some charts – those are for battery state of charge and don’t apply in this situation. The numbers on the left axis are the ones you want to pay attention to.)
Hope this helps!
Double peak:

Evening peak:

High day, evening peak:

Day focus:
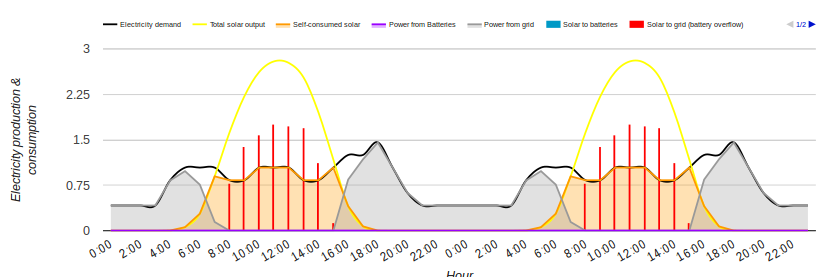
Evening focus:

Excellent site thanks. One question please. Am I right in thinking the household demand gets precedence for the PV generated electricity and any surplus then goes to the grid or
all PV generated electricity goes straight to the grid and a credit is given for any surplus between what is exported exported to the grid and what is imported to the household?
We live in Tasmania if that makes any difference to the answer.
Many thanks
Hi Mike,
Thanks for the comment. These days, the vast majority of solar energy systems are ‘net metered’, which basically means that your meter flows in two directions. So you correctly described what happens in your first guess – basically, the power from your solar panels will go directly into your home and flow into any devices that are in operation. Whatever is not used is then sent into the grid and you get a credit.
It’s very rare these days for anyone to have a ‘gross metering’ setup – which is the second situation you described. This is because it makes no sense economically: why would you export your solar power to the grid for 8¢/kWh when you could use it yourself and save up to 25-30¢/kWh? It’s best to use as much of the solar power you generate as you possibly can. (This is what is driving so many Australians to consider energy storage systems.)